Bluefruit graphing - beware auto scaling
Bluefruit app
For my upcoming Raspberry Pi Pico robotics book, I make use of Bluetooth and the Adafruit Bluefruit LE Connect App which lets me interact over BLE UART, and plot data from it. Awesome.
While I’ll go into specifics in the book, I thought this particular adventure, a little too anecdotal for that book, would make for an interesting blog entry.
Story
I was debugging an encoder problem. I thought it was my code doing something janky, when measuring speed (distance/time, with a ticks to mm conversion) I got this kind of graph:
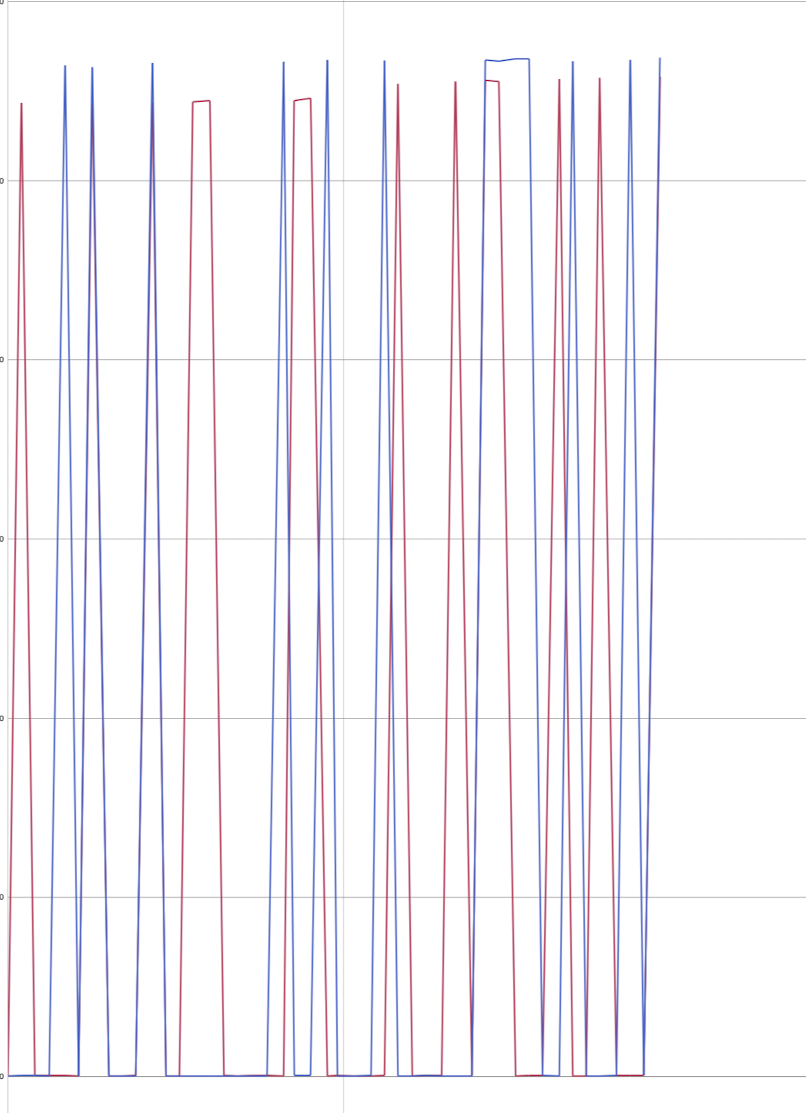
The red and blue lines show the left and right encoder speeds. The graph makes it looks like there are large differences in their behaviour. In reality, these differences are tiny, and the graph is just auto-scaling to make it look like there are big differences.
I thought I had some stability issue in my encoder reading, or the PIO code I’d written to sample the encoder was wrong. So I went from the d/t to simply plotting encoder counts on a line:
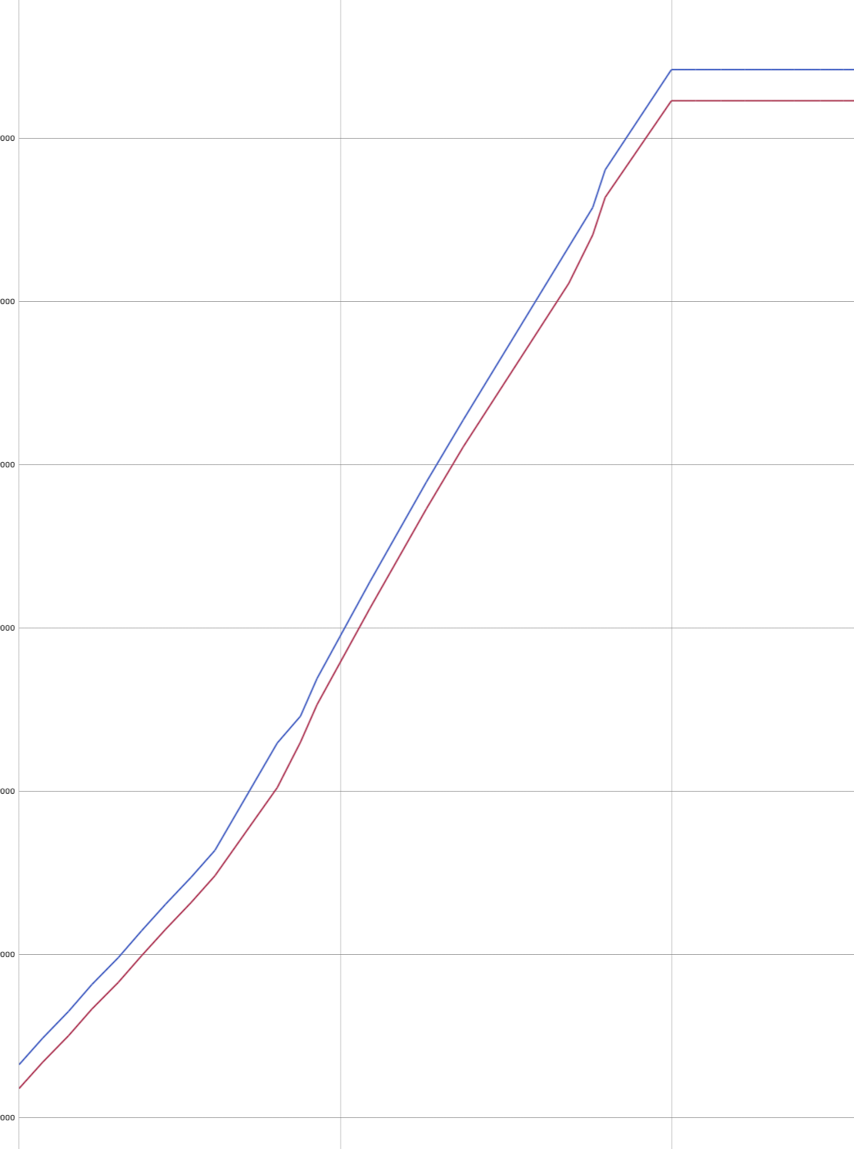
This led to see there’s nothing wrong with the encoders. And then it dawned on me - the scale was different. The top graph didn’t start at 0 - the tiny variations (which might do horrid things for a derivative without a low-pass-filter) were amplified over this scale because the speed was actually stable in a fairly small range.
Adding a 0 into the graphing code allows me to anchor the graph at 0, and see that the encoders are very stable:
uart.write(f"{left_speed:.3f},{right_speed:.3f},0\n".encode())
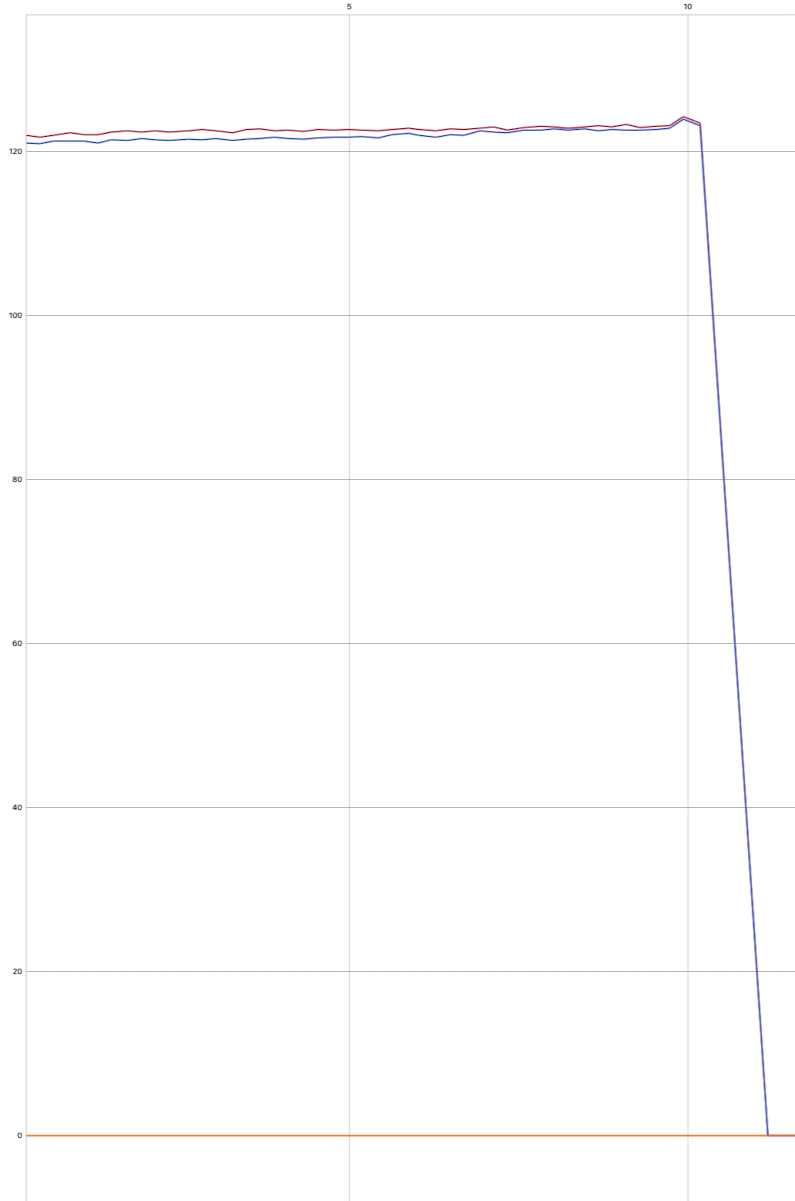
Always be aware of graph anchoring and scaling - it can send you on a wild goose chase.
Robotics at Home with Raspberry Pi Pico
This post was based on research I did for the book Robotics at Home with Raspberry Pi Pico which is available now.