I’m getting intimately familiar with Gaussian probability and generating them, along with combining matplotlib and asyncio for pc visualising.
CircuitPython does not have random.gauss (or np.rand.normal).
I’ve been studying probability density functions, with the intent of generating Gaussian numbers on a Pico. I’ve also been spending lots of time with matplotlib, and comparing my guess with the python and the Numpy Gaussian outputs. This is with the intent of using it in my upcoming book Robotics at Home with Raspberry Pi Pico.
I’ve found that looking at the Marsaglia polar method is making a lot of sense to me. I read that the ziggurat method is likely more efficient but I’m pitching for not too complicated.
The bell curve (characteristic of the probability density of Gauss distribution) looked vaguely sine like. A 3 blue 1 brown video helped see the calculus link https://youtu.be/ZA4JkHKZM50.
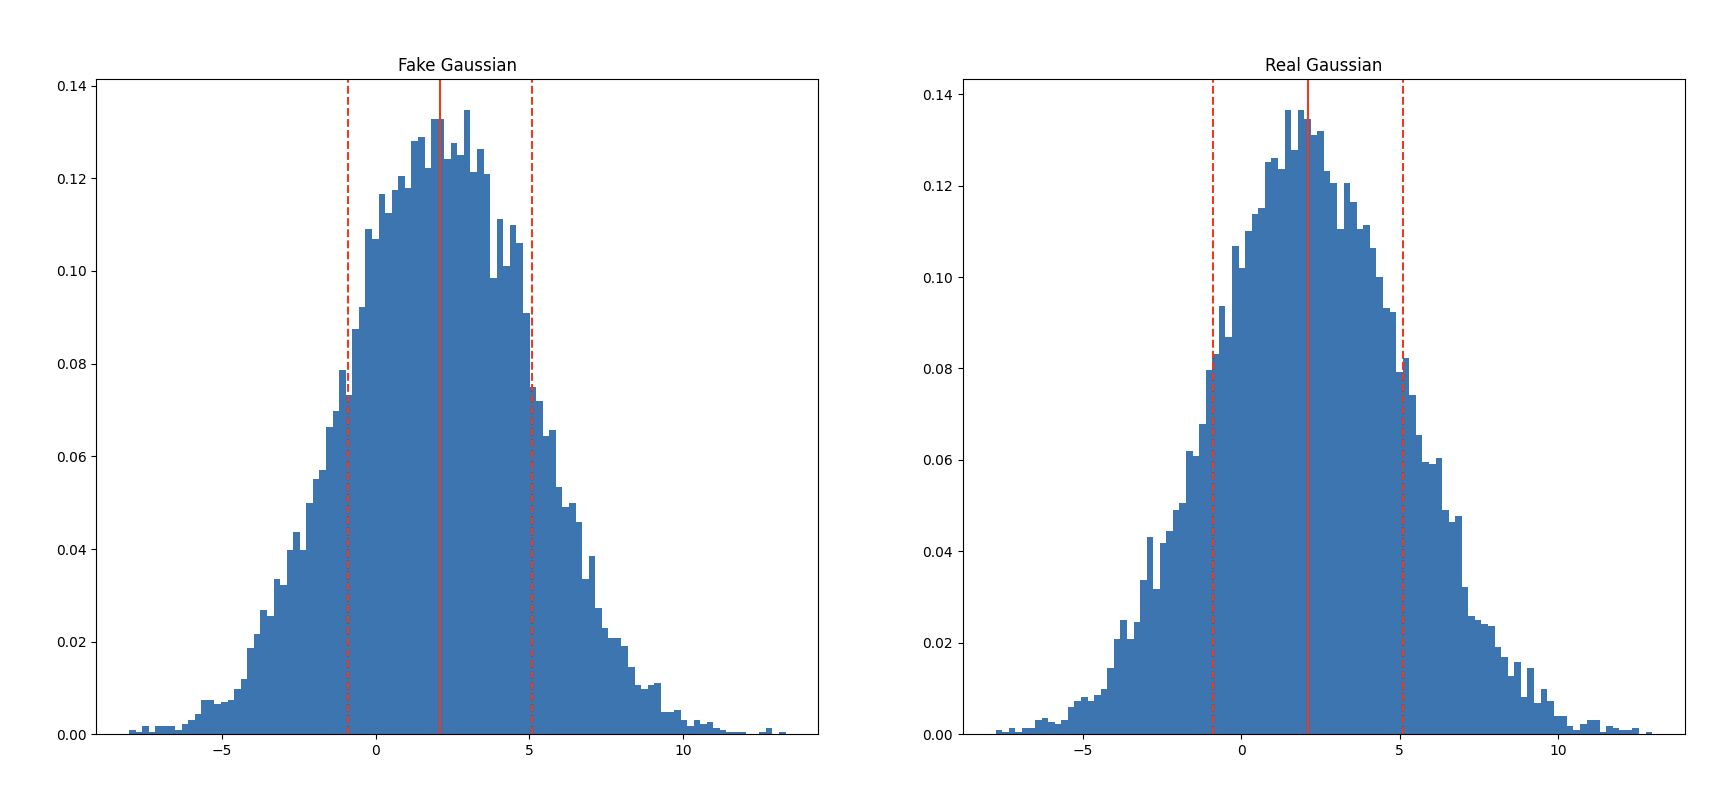
The “Real Gaussian” is python’s random.gauss.
The “Fake Gaussian” is random.uniform fed into the Marsaglia polar method.
This output is then plotted with matplotlib.
This random distribution’s relevance in robotics is around making increasingly closer guesses to a solution.
Gaussian on CircuitPython
Here is the code for implementing this on any python implementation with random.uniform, where random.gauss is not available. I’ve used the random module, and the math module.
import random
import math

def get_standard_normal_sample():
    """Using the Marasaglia Polar method"""
    while True:
        u = random.uniform(-1, 1)
        v = random.uniform(-1, 1)
        s = u * u + v * v
        if s >= 1:
            continue
        return u * math.sqrt(-2 * math.log(s) / s)

def get_scaled_gaussian_sample(mean, standard_deviation):
    return get_standard_normal_sample() * standard_deviation + mean
The way this works is to create two uniform random samples on a square. It then uses the Pythagorean theorem to see if the point is inside the circle. If it is, it uses the polar coordinates to get a normal distribution. If not, it will try more samples until it gets one that is.
The standard sample will have a mean of 0 and a standard deviation of 1. The scaled sample will have a mean of whatever you pass in, and a standard deviation of whatever you pass in.
Robotics at Home with Raspberry Pi Pico
This post was based on research I did for the book Robotics at Home with Raspberry Pi Pico which is available now.